Which app is failing, and why: turning Intune app errors into a triage board

Intune's app install status is a sea of red per-device rows. What it won't tell you at a glance is which app is the problem, how bad, and who should fix it. This is the read-only collector that rolls every failure up per app and triages it into a category, an owner, and a remediation.
The payoff
Triaging app-install failures device-by-device is hours of scrolling per incident. Rolling them up per app surfaces the worst offender in one view — fix a single package with a 25–40% failure rate and thousands of individual device errors clear at once. (Illustrative.)
The short version
Intune shows app failures device-by-device. This read-only collector aggregates per app — failed vs installed vs targeted, a failure rate, and a triage category with an owner and a fix — so you act on the worst app, not scroll rows. No write access, no live tenant in the report.
Why the portal doesn't hand you this
- It's per-device, not per-app. You can see one machine failed an install; you can't easily see "this app is failing on 40% of targets".
- Error codes aren't answers. A hex code per device isn't a plan — it needs mapping to a category, a likely cause, and an owner.
- No prioritisation. The console doesn't rank apps by blast radius, so the loudest failure — not the biggest — gets attention.
What's different about this report
One row per app — from the AppInstallStatusAggregate report: failed devices, installed, total targeted, and a failure rate, plus the publisher and platform. The rate is failed ÷ applicable, where applicable is every device the app should have reached — failed + installed + notInstalled + pending. Devices marked notApplicable (wrong platform, or unmet requirement rules) are left out, so they can't dilute the number. Sort by failed count and the worst offender is line one — the triage the per-device view can't give you.
For example, one row might read Contoso VPN Client · 412 targeted (400 applicable) · 96 failed · 24.0% fail rate, and the next Adobe Reader · 2,000 applicable · 12 failed · 0.6% — telling you at a glance to chase the VPN client, not the noisy-but-harmless Reader errors. (96 ÷ 400 = 24.0%; the 12 non-applicable devices are excluded from the denominator.)
How it works: a read-only collector
The read-only Graph roles are all .Read.All: DeviceManagementApps.Read.All for the apps and install reports, and DeviceManagementManagedDevices.Read.All for the device join. Nothing writes — the POST to /deviceManagement/reports/exportJobs is simply how Intune hands you a report (you request the export, then GET the file); it's a read-export that changes nothing in the tenant. (Graph's beta reporting endpoints don't cleanly document the scope the export call maps to, so confirm the exact read role against your own app.)
Verify before you trust it
The rollup uses the AppInstallStatusAggregate reports export job (per-app counts); for
device-level detail on a single app it's DeviceInstallStatusByApp filtered to that applicationId
(one export per app — you can't pull the whole fleet at once). Export schemas evolve, so confirm the
report and columns in your own lab tenant. Every figure in the screenshots is synthetic lab data (@contoso.com).
The Power BI report
The report ranks the fleet's app pain: failed installs by publisher, by platform, and by app, with a table sorted so the highest-impact failure sits at the top.
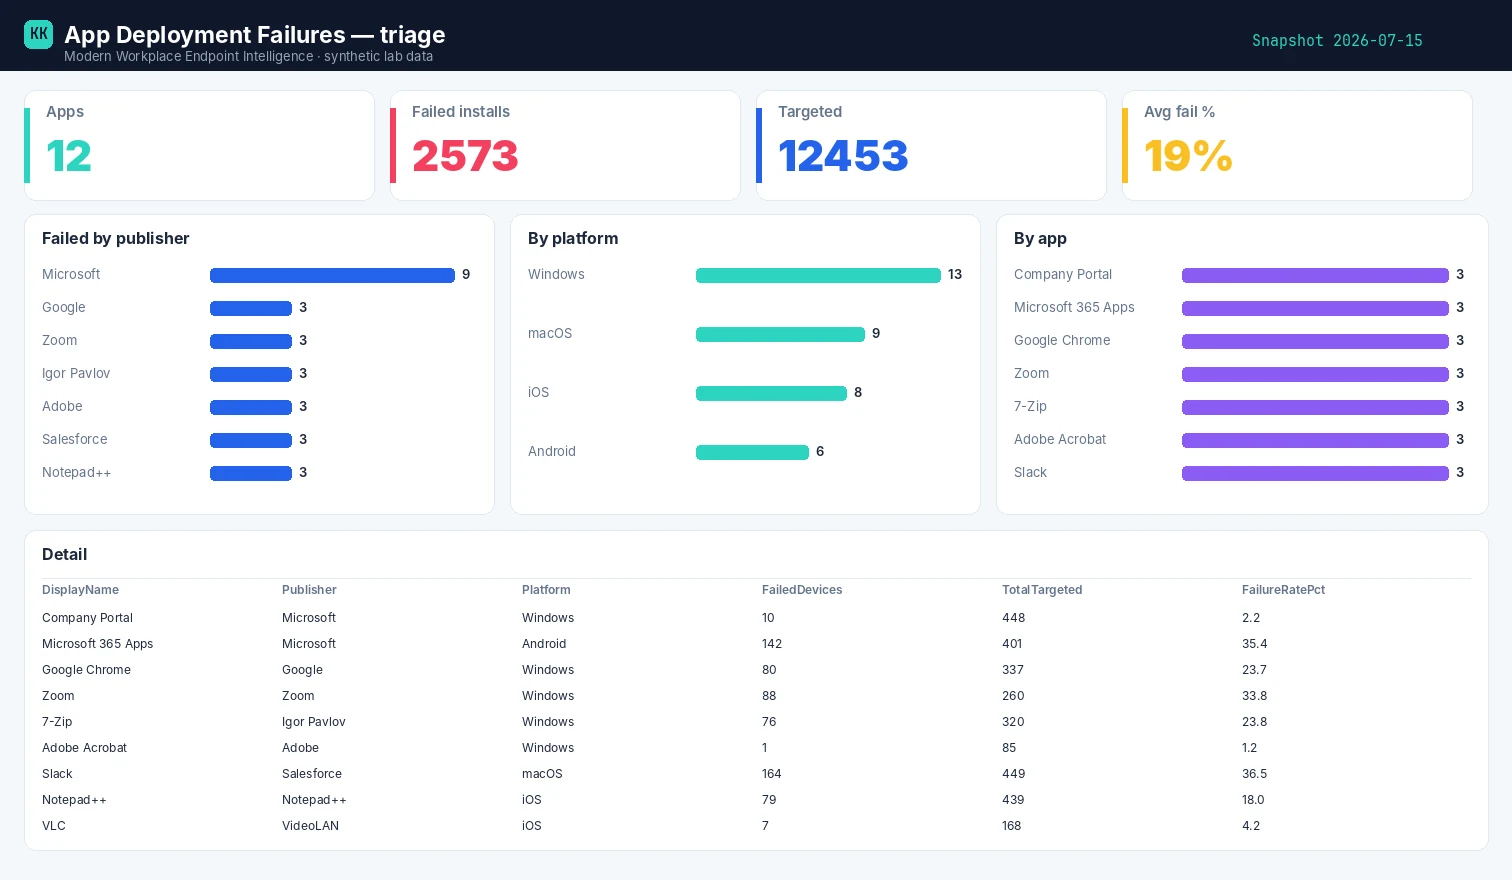
Template + build kit on the App Deployment Failures report page.
Set it up, step by step
You don't build this one from scratch. Every collector shares the same read-only plumbing, so you set that up once — after that, adding this report is about a five-minute job.
- One-time — stand up the collection layer. Follow Setting up the collection layer: an Azure Automation account, a system-assigned Managed Identity (no secrets, no app registration), and a storage account for the CSV snapshots. You only do this once, however many collectors you end up running.
- Grant this collector's read-only scopes. In that guide's role-assignment step, add the scopes this one needs —
DeviceManagementApps.Read.AllandDeviceManagementManagedDevices.Read.All. Every one ends in.Read.All: it reads, and never writes to your tenant. (Running more than one collector? Scopes are additive — add the new ones, don't replace what's already granted.) - Import the script as a runbook. Take the script, import it into the Automation Account as a PowerShell 7 runbook, and publish it.
- Schedule it. Attach a daily (or weekly) schedule the same way the setup guide shows. It then runs unattended, dropping a dated CSV into your
root/container each time. - Point Power BI at the CSV. Open the report template in Power BI Desktop and start with the bundled synthetic sample, so you can build the whole thing before touching real data. To switch to live data, use Get Data → Azure Blob Storage and point it at the dated CSV in your
root/container (the setup guide has the storage account and connection details). Refresh, and that's your dashboard.
No secrets, no app registration, nothing that can change your tenant — just a scheduled read and a CSV that Power BI draws from.
Gotchas from the lab
- Rate without volume misleads. 100% failure on a 2-device pilot isn't your fire; 20% on a 600-device rollout is.
- Platform matters. The same app can be healthy on Windows and broken on iOS — always keep the platform column.
- Count devices, not attempts. A device that retried five times is one failing device, not five.
Reproduce it yourself
The synthetic fleet generator can emit a realistic, entirely
fictional App_Deployment_Failures.csv so you can build and demo the whole report before pointing it at real data.
FAQ
How is the failure rate calculated? failed ÷ applicable, where applicable excludes notApplicable devices (wrong platform / unmet requirements) so they don't dilute the number.
Can I get device-level detail for one app? Yes — a separate DeviceInstallStatusByApp export filtered to that applicationId, one app at a time.
Does a retrying device count multiple times? No — count devices, not attempts; a device that retried five times is one failing device.
More in this series
Related
- The script → App Deployment Failures
- The report + template → App Deployment Failures report
- The bigger picture → Zero-Access Agent
- The capstone → The read-only AI agent that can't touch your tenant
References — Microsoft documentation
The Microsoft Learn documentation behind this one, if you want to go to the source:
- Monitor app assignments — per-app install/status monitoring: Monitor app information and assignments
- Troubleshoot app installs — diagnosing failed installs: Troubleshoot app installation issues with Intune
- Win32 app troubleshooting — Win32 install-failure detail: Troubleshoot Win32 apps in Microsoft Intune
- App install error codes — mapping codes to causes: Application installation error reference
- Install status (Graph) — the per-device app-install state: mobileAppInstallStatus resource type
- mobileApp resource (Graph) — the app object being triaged: mobileApp resource type
Screenshots use synthetic data from a personal lab — no real tenant, users, or devices. Independent content, not affiliated with, sponsored by, or endorsed by Microsoft. Microsoft, Intune, Entra, Microsoft Graph, Azure, Defender and Power BI are trademarks of the Microsoft group of companies.

I build read-only Intune & Entra tooling in the open and write about what the portal is actually doing underneath. Everything comes from a personal lab.