Autopilot Operations — Power BI report
Built on the read-only snapshot from the Autopilot Operations script — no live tenant connection, just the sanitized CSV the collector writes to Blob.
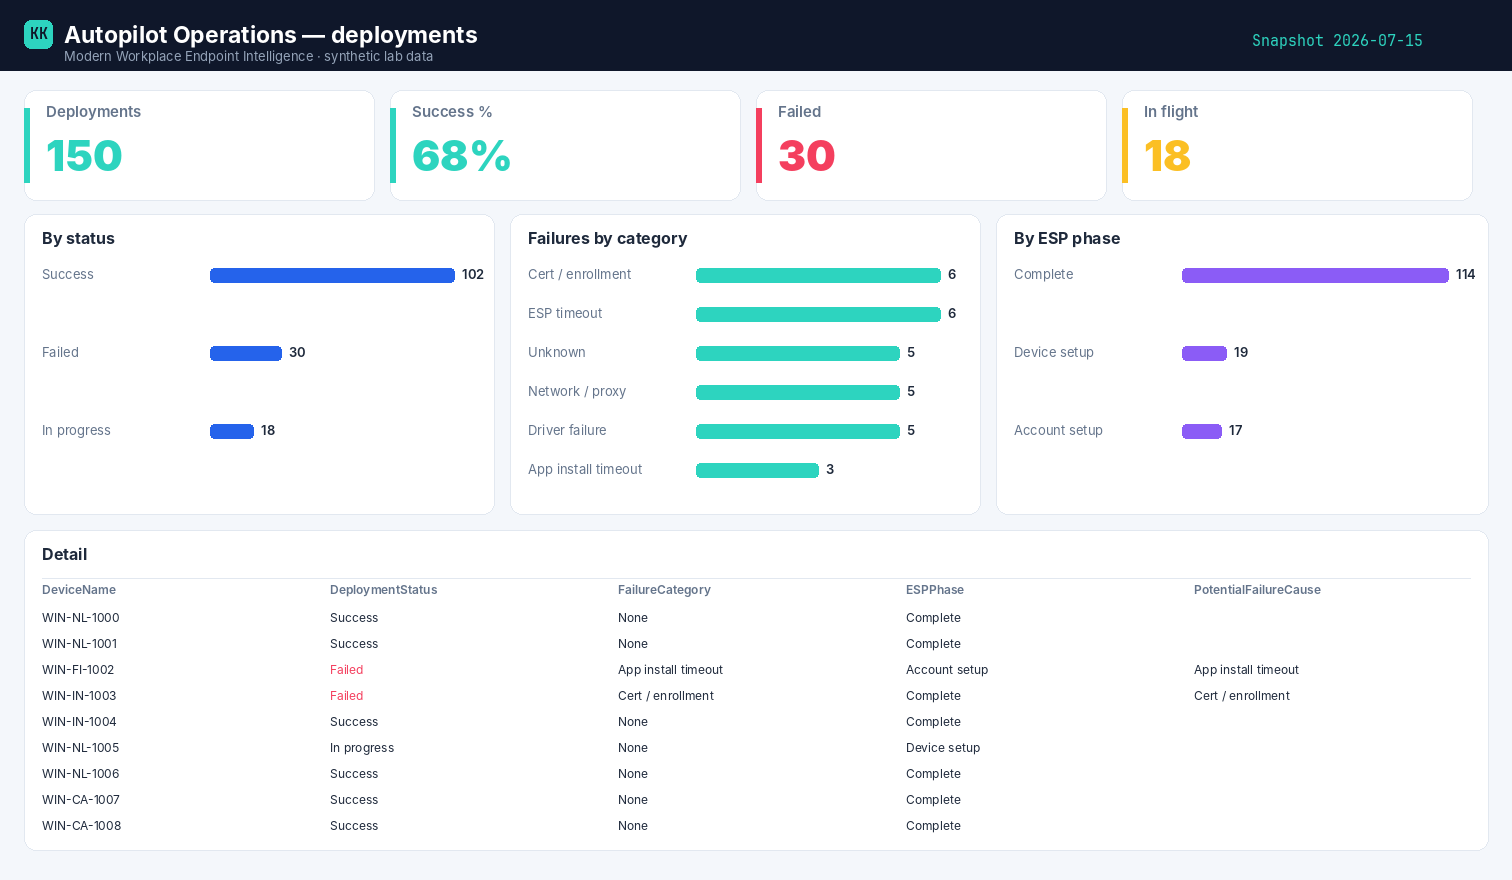
Example built on synthetic @contoso.com data.
Download the template
Autopilot Operations template (.pbit)
Opens to a finished report
The .pbit carries the data model, every DAX measure, and a pre-built report page
(KPI cards, bar charts, a detail table and slicers). On open it prompts for three parameters —
StorageAccount, ContainerName, FileName — then for your storage credentials, and
loads straight from the container your collector writes to. No manual building.
The measures
Total Deployments = DISTINCTCOUNT(Autopilot[DeviceName])
Success %         = DIVIDE(CALCULATE(DISTINCTCOUNT(Autopilot[DeviceName]), Autopilot[DeploymentStatus] = "Success"), [Total Deployments])
Failed            = CALCULATE(DISTINCTCOUNT(Autopilot[DeviceName]), Autopilot[DeploymentStatus] = "Failed")
In Flight         = CALCULATE(DISTINCTCOUNT(Autopilot[DeviceName]), Autopilot[IsInFlightAtSnapshot] = "true")
How it's wired
The collector writes the CSV to your storage account; the template reads it from Blob. Because the shaping and pre-aggregation already happened in the runbook, Power BI stays thin — connect, refresh, slice. Swap the three parameters for your own container and nothing else changes.
Related
- The script → Autopilot Operations
- The story → Where Autopilot actually breaks
- Part of → Zero-Access Agent