Where Autopilot actually breaks: ESP phase, failure category, per deployment
When an Autopilot build fails, the technician sees a spinning ESP and a vague error. What the fleet owner needs is the pattern: which phase deployments die in, which category of failure dominates, and which app keeps timing out. This read-only collector turns Autopilot events into that operational picture.
The payoff
Chasing Autopilot / ESP failures one device at a time can burn a day and still leave you guessing. Classified by phase and cause, one blocking step — say an app install timing out — explains the bulk, so you fix it once instead of reprovisioning blind. (Illustrative.)
The short version
Autopilot failures are opaque one device at a time. This read-only collector reads deployment events and ESP state, classifies each into a phase and a failure category with a likely cause, and flags what's still in flight — so you fix the pattern, not the panic. No write access, no live tenant in the report.
Why the portal doesn't hand you this
- The ESP hides the phase. A stuck build looks the same whether it died in device preparation, device setup, or account setup — the console won't tell you which of the three dominates your failures.
- App timeouts are the usual culprit, unnamed. Most ESP failures trace to a blocking app, but you can't see which app across the fleet from the portal.
- No in-flight vs done split. "Failed" and "still running" blur together, so you can't tell a real failure rate from deployments simply mid-build.
What's different about this report
One row per deployment: the status, the ESP phase it reached, a failure category and cause, the count of blocking app failures, and an in-flight flag — the operational breakdown that turns "Autopilot is flaky" into "fix the app that times out in device setup".
For example, a row might read Deployment 8821 · Failed · phase: Device setup · category: App install timeout (Contoso VPN) · 1 blocking app — the ESP didn't fail because Autopilot is flaky, it died waiting on one Win32 app. Find that app across the failures and the rate collapses.
How it works: a read-only collector
The read-only Graph roles are all .Read.All: DeviceManagementManagedDevices.Read.All covers the autopilotEvents (the least-privileged permission that endpoint accepts — Microsoft doesn't document a dedicated scope for it, but this read-only role is what Graph grants it under), DeviceManagementConfiguration.Read.All the ESP and enrolment configuration, and DeviceManagementApps.Read.All the blocking apps. Nothing writes.
Verify before you trust it
autopilotEvents and ESP run states are beta endpoints and evolve. The failure categories are
derived by the runbook from the event state plus the blocking-app join — they're operator-defined,
not a native Graph field — so confirm the event states and phase names in your own lab tenant
before trusting the categorisation. Every figure in the screenshots is synthetic lab data (@contoso.com).
The Power BI report
The report is an operations dashboard: deployments by status, failures by category, and by ESP phase, with a table that filters to any failing phase so you can chase the one blocking app.
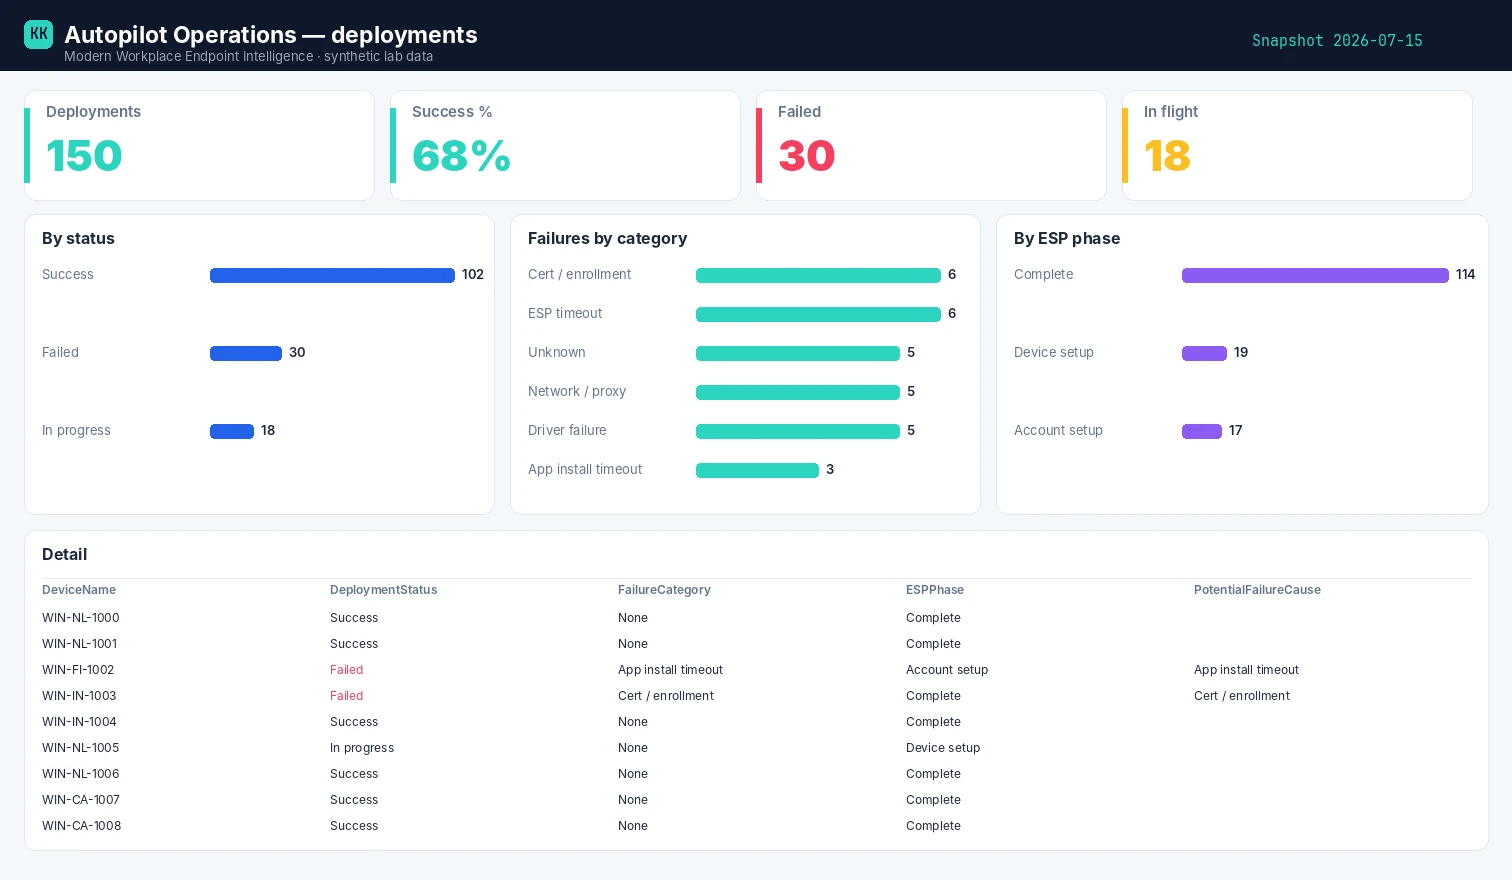
Template + build kit on the Autopilot Operations report page.
Set it up, step by step
You don't build this one from scratch. Every collector shares the same read-only plumbing, so you set that up once — after that, adding this report is about a five-minute job.
- One-time — stand up the collection layer. Follow Setting up the collection layer: an Azure Automation account, a system-assigned Managed Identity (no secrets, no app registration), and a storage account for the CSV snapshots. You only do this once, however many collectors you end up running.
- Grant this collector's read-only scopes. In that guide's role-assignment step, add the scopes this one needs —
DeviceManagementApps.Read.All,DeviceManagementConfiguration.Read.AllandDeviceManagementManagedDevices.Read.All. Every one ends in.Read.All: it reads, and never writes to your tenant. (Running more than one collector? Scopes are additive — add the new ones, don't replace what's already granted.) - Import the script as a runbook. Take the script, import it into the Automation Account as a PowerShell 7 runbook, and publish it.
- Schedule it. Attach a daily (or weekly) schedule the same way the setup guide shows. It then runs unattended, dropping a dated CSV into your
root/container each time. - Point Power BI at the CSV. Open the report template in Power BI Desktop and start with the bundled synthetic sample, so you can build the whole thing before touching real data. To switch to live data, use Get Data → Azure Blob Storage and point it at the dated CSV in your
root/container (the setup guide has the storage account and connection details). Refresh, and that's your dashboard.
No secrets, no app registration, nothing that can change your tenant — just a scheduled read and a CSV that Power BI draws from.
Gotchas from the lab
- In-flight isn't failed. Exclude live builds from your failure rate or every busy enrolment day looks like an outage.
- The phase points at the cause. Device preparation failures are usually enrolment / Entra join; device setup is device-targeted apps, drivers and certs; account setup is user-targeted apps and policy — the phase is your first triage.
- One app can dominate. A single blocking Win32 app timing out can account for most ESP failures — find it and the rate collapses.
Reproduce it yourself
The synthetic fleet generator can emit a realistic, entirely
fictional Autopilot_Operations_Detailed.csv so you can build and demo the whole report before pointing it at real data.
FAQ
Does it read live Autopilot state? It reads autopilotEvents and ESP status through Graph, read-only — no live control-plane connection in the report.
Are the failure categories official Graph fields? No — they're derived by the runbook from the event state plus the blocking-app join, so confirm the event states in your lab.
Why separate in-flight from failed? A live build isn't a failure; excluding in-flight keeps a busy enrolment day from looking like an outage.
More in this series
Related
- The script → Autopilot Operations
- The report + template → Autopilot Operations report
- The bigger picture → Zero-Access Agent
- The capstone → The read-only AI agent that can't touch your tenant
References — Microsoft documentation
The Microsoft Learn documentation behind this one, if you want to go to the source:
- Windows Autopilot — the deployment fundamentals: Overview of Windows Autopilot
- Enrollment Status Page — the ESP phases a deployment moves through: Windows Autopilot Enrollment Status Page
- Set up ESP — configuring ESP behaviour: Set up the Enrollment Status Page
- Troubleshoot ESP — diagnosing which phase failed: Troubleshoot the Enrollment Status Page
- Autopilot troubleshooting — failure categories and fixes: Windows Autopilot troubleshooting FAQ
- Autopilot known issues — documented break points: Windows Autopilot known issues
Screenshots use synthetic data from a personal lab — no real tenant, users, or devices. Independent content, not affiliated with, sponsored by, or endorsed by Microsoft. Microsoft, Intune, Entra, Microsoft Graph, Azure, Defender and Power BI are trademarks of the Microsoft group of companies.

I build read-only Intune & Entra tooling in the open and write about what the portal is actually doing underneath. Everything comes from a personal lab.