Inventory — All Devices — Power BI report
Built on the read-only snapshot from the Inventory — All Devices script — no live tenant connection, just the sanitized CSV. One row per device, everything already joined.
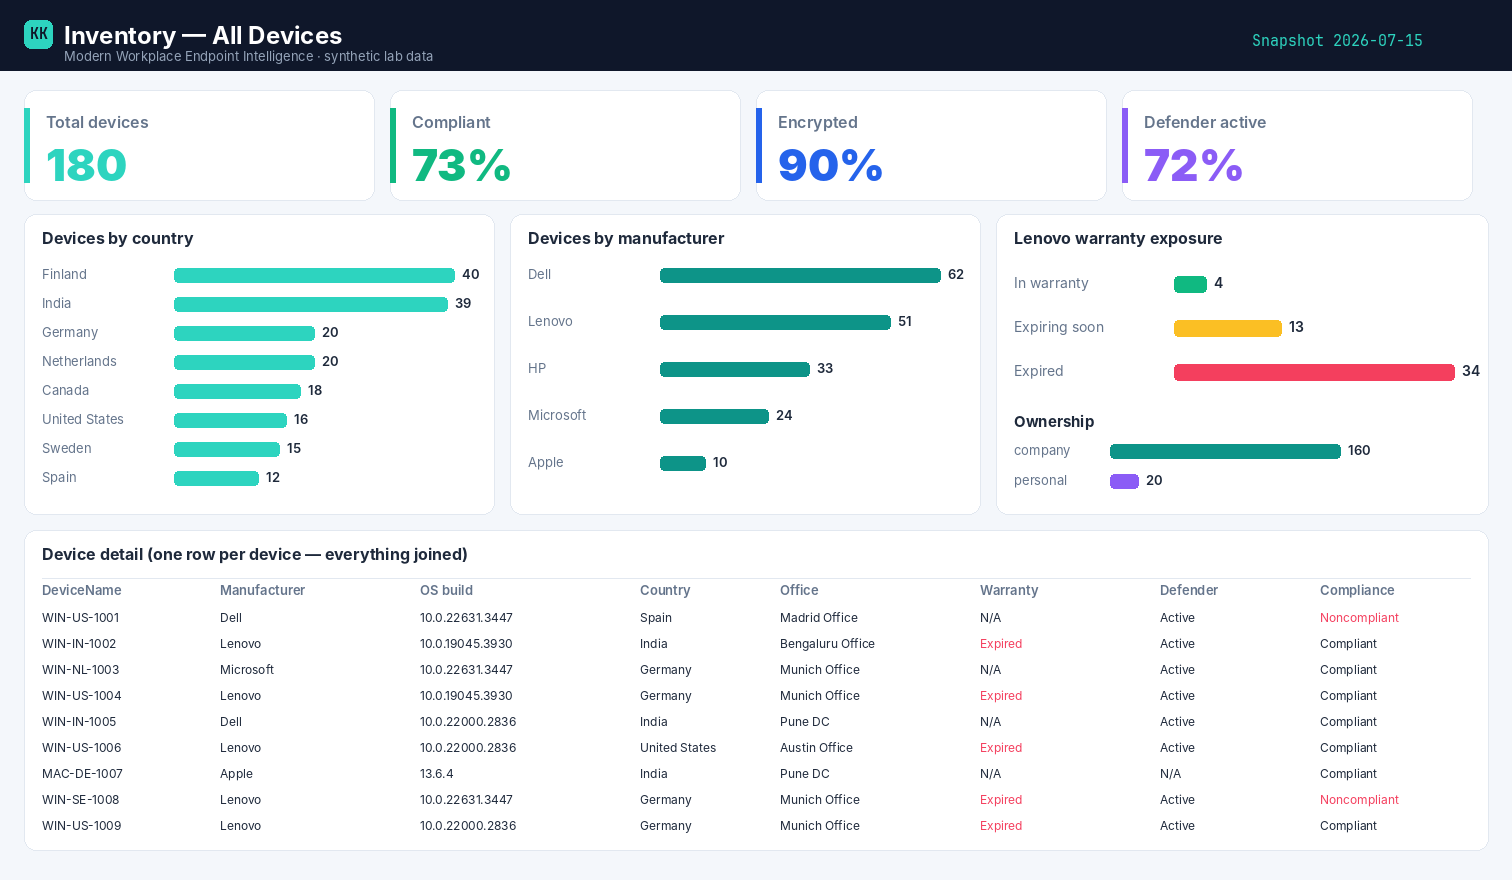
Example built on synthetic @contoso.com data — 180 devices.
Download the template
Inventory — All Devices template (.pbit)
Opening the template
The .pbit carries the parameterised CSV connection, the full 26-column schema, and every
DAX measure — on a blank canvas, so the visuals are yours to drop in (~5 minutes with the layout
below). On open it asks for SnapshotCsvPath — point it at your Inventory_AllDevices.csv and
refresh. If your Power BI Desktop is older and the template complains, the build kit below rebuilds
it from scratch.
Build kit
1 · Power Query (the connection)
The parameter SnapshotCsvPath (Text) feeds one query:
let
    Source = Csv.Document(File.Contents(SnapshotCsvPath), [Delimiter=",", Encoding=65001, QuoteStyle=QuoteStyle.Csv]),
    Promoted = Table.PromoteHeaders(Source, [PromoteAllScalars=true])
in
    Promoted
2 · DAX measures
Total Devices          = DISTINCTCOUNT(Devices[DeviceName])
Compliant              = CALCULATE([Total Devices], Devices[ComplianceStatus] = "Compliant")
Compliant %            = DIVIDE([Compliant], [Total Devices])
Non-Compliant          = CALCULATE([Total Devices], Devices[ComplianceStatus] = "Noncompliant")
Encrypted %            = DIVIDE(CALCULATE([Total Devices], Devices[Encrypted] = "true"), [Total Devices])
Defender Active %      = DIVIDE(CALCULATE([Total Devices], Devices[DefenderState] = "Active"), [Total Devices])
Out of Warranty        = CALCULATE([Total Devices], Devices[WarrantyState] = "Expired")
Warranty Expiring Soon = CALCULATE([Total Devices], Devices[WarrantyState] = "Expiring soon")
Always count devices, not rows
Every count keys off DISTINCTCOUNT(Devices[DeviceName]). Once a device carries multiple policies
or apps, a naïve row count double-counts it — the measures above never do.
3 · Visual layout (matches the screenshot)
| Row | Visual | Field / measure |
|---|---|---|
| Top | 4 × Card | Total Devices, Compliant %, Encrypted %, Defender Active % |
| Middle-left | Bar chart | Axis UserCountry, value Total Devices |
| Middle-centre | Bar chart | Axis Manufacturer, value Total Devices |
| Middle-right | Stacked bar | Legend WarrantyState, value Total Devices; add OwnerType split |
| Bottom | Table | DeviceName, Manufacturer, OSVersion, UserCountry, UserOfficeLocation, WarrantyState, DefenderState, ComplianceStatus |
| Slicers | UserCountry, OwnerType, ComplianceStatus |
cross-filter everything |
How it's wired
The report points at the CSV the collector writes — because the shaping and pre-aggregation already happened in the runbook, the Power BI side stays thin: connect, refresh, slice. Swap the parameter path for your own container and nothing else changes.
Related
- The script → Inventory — All Devices
- The story → One row per device
- Part of → Zero-Access Agent