Local AI Agent Inventory — Power BI report
Built on the read-only snapshot from the Local AI Agent Inventory script — no live tenant connection, just the sanitized CSV. A tall table: one row per device × AI tool.
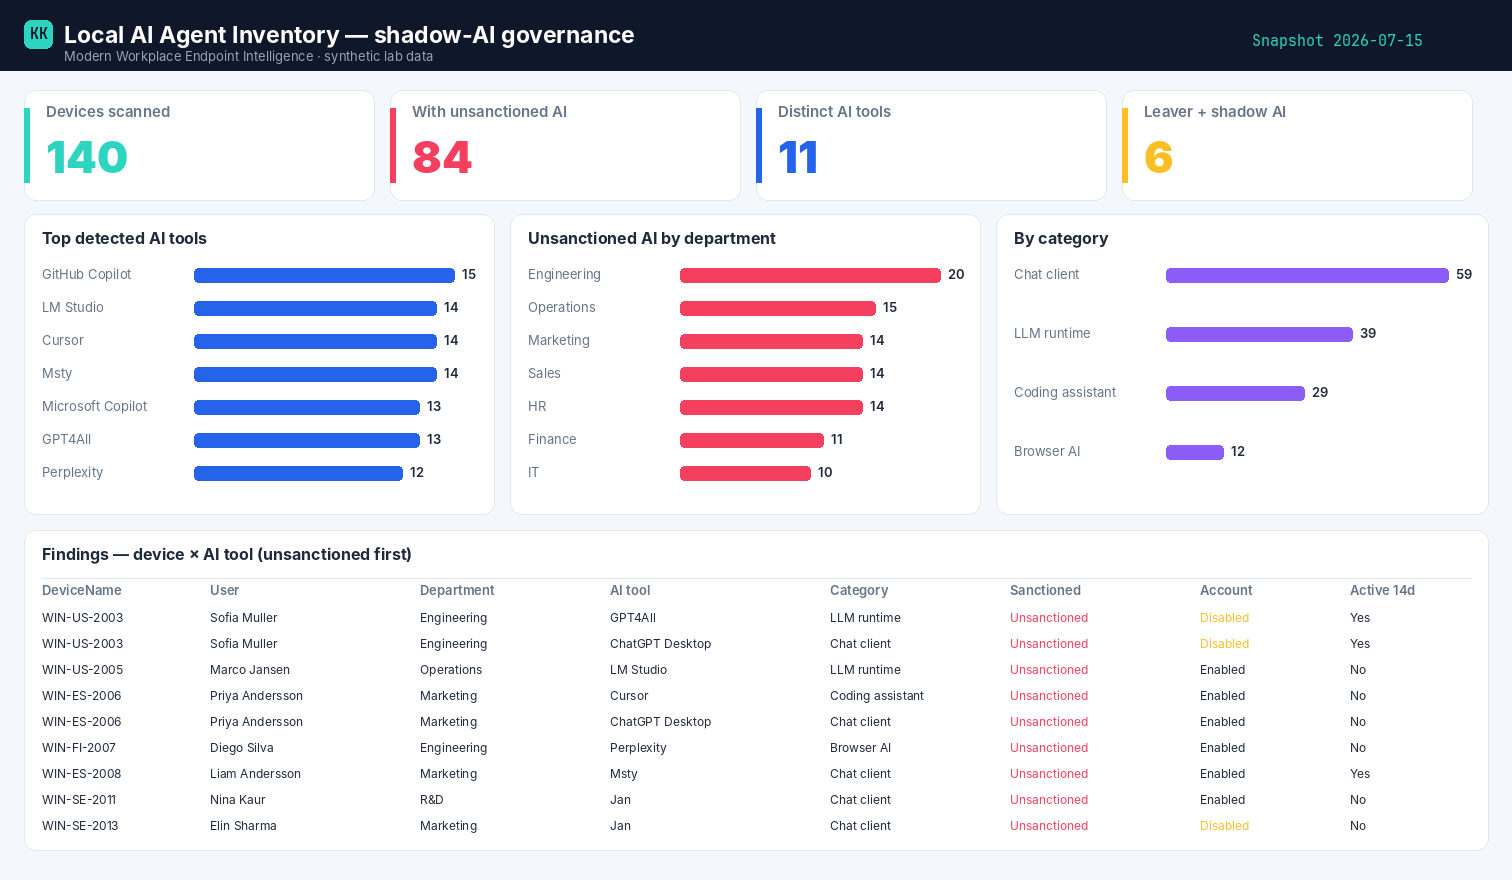
Example built on synthetic @contoso.com data — 140 devices, 84 carrying unsanctioned AI.
Download the template
Local AI Agent Inventory template (.pbit)
Opening the template
The .pbit carries the parameterised CSV connection, the full schema and the governance DAX
measures on a blank canvas. On open it asks for SnapshotCsvPath — point it at your
AIAgentInventory.csv and refresh, then drop in the visuals below (~5 min). If your Power BI
Desktop is older and it complains, the build kit rebuilds it from scratch.
Build kit
1 · Power Query (the connection)
let
    Source = Csv.Document(File.Contents(SnapshotCsvPath), [Delimiter=",", Encoding=65001, QuoteStyle=QuoteStyle.Csv]),
    Promoted = Table.PromoteHeaders(Source, [PromoteAllScalars=true])
in
    Promoted
2 · DAX measures (governance)
Total Devices              = DISTINCTCOUNT(AIAgents[DeviceName])
Devices with Unsanctioned AI = CALCULATE(DISTINCTCOUNT(AIAgents[DeviceName]), AIAgents[AIAgentSanctioned] = "Unsanctioned")
% Devices Unsanctioned      = DIVIDE([Devices with Unsanctioned AI], [Total Devices])
Unsanctioned Instances      = CALCULATE(COUNTROWS(AIAgents), AIAgents[AIAgentSanctioned] = "Unsanctioned")
Distinct AI Tools           = CALCULATE(DISTINCTCOUNT(AIAgents[AIAgentName]), AIAgents[AIAgentName] <> "None")
Leaver + Shadow AI          = CALCULATE(DISTINCTCOUNT(AIAgents[DeviceName]), AIAgents[AccountStatus] = "Disabled", AIAgents[AIAgentSanctioned] = "Unsanctioned")
The measure that matters
Leaver + Shadow AI — disabled account and unsanctioned AI. That's the number for your security
team: someone who left, whose device still carries a local model and its cached data.
3 · Visual layout (matches the screenshot)
| Row | Visual | Field / measure |
|---|---|---|
| Top | 4 × Card | Total Devices, Devices with Unsanctioned AI, Distinct AI Tools, Leaver + Shadow AI |
| Middle-left | Bar chart | Axis AIAgentName (exclude None), value Unsanctioned Instances |
| Middle-centre | Bar chart | Axis Department, value Devices with Unsanctioned AI |
| Middle-right | Bar chart | Axis AIAgentCategory, value Unsanctioned Instances |
| Bottom | Table | DeviceName, UserDisplayName, Department, AIAgentName, AIAgentCategory, AIAgentSanctioned, AccountStatus, IsActiveLast14Days — filter AIAgentSanctioned = "Unsanctioned" |
| Slicers | Department, AIAgentSanctioned, AccountStatus |
cross-filter everything |
Count devices, not rows
The table is tall (one row per device per tool). Device counts use DISTINCTCOUNT(AIAgents[DeviceName])
or filter on IsPrimaryDeviceRow = "Yes"; tool-instance counts use the full table. Never mix them.
How it's wired
The report points at the CSV the collector writes. The detection happens on the device, the shaping in the runbook — so Power BI stays thin: connect, refresh, slice. Swap the parameter path for your own container.
Related
- The script → Local AI Agent Inventory
- The story → Who's running Ollama on your fleet?
- Part of → Zero-Access Agent